The State of Craft Beer
Filed Under: Best Practices, Market Research, Alcohol, Quantitative Research
If you keep thinking that everywhere you turn there’s a new craft brewery popping up—it’s not just your imagination. A craft beer revolution has swept over America. Whether you enjoy a good IPA or you prefer a dark porter, it’s likely that you can find a craft beer or brewery not too far from your doorstep.
We decided to take a closer look at the craft beer industry to determine where craft beer is most popular. We also measured the growth of craft beer within the last decade and its economic impact per capita. Here’s what we found in our research.
The Craft Beer Scale
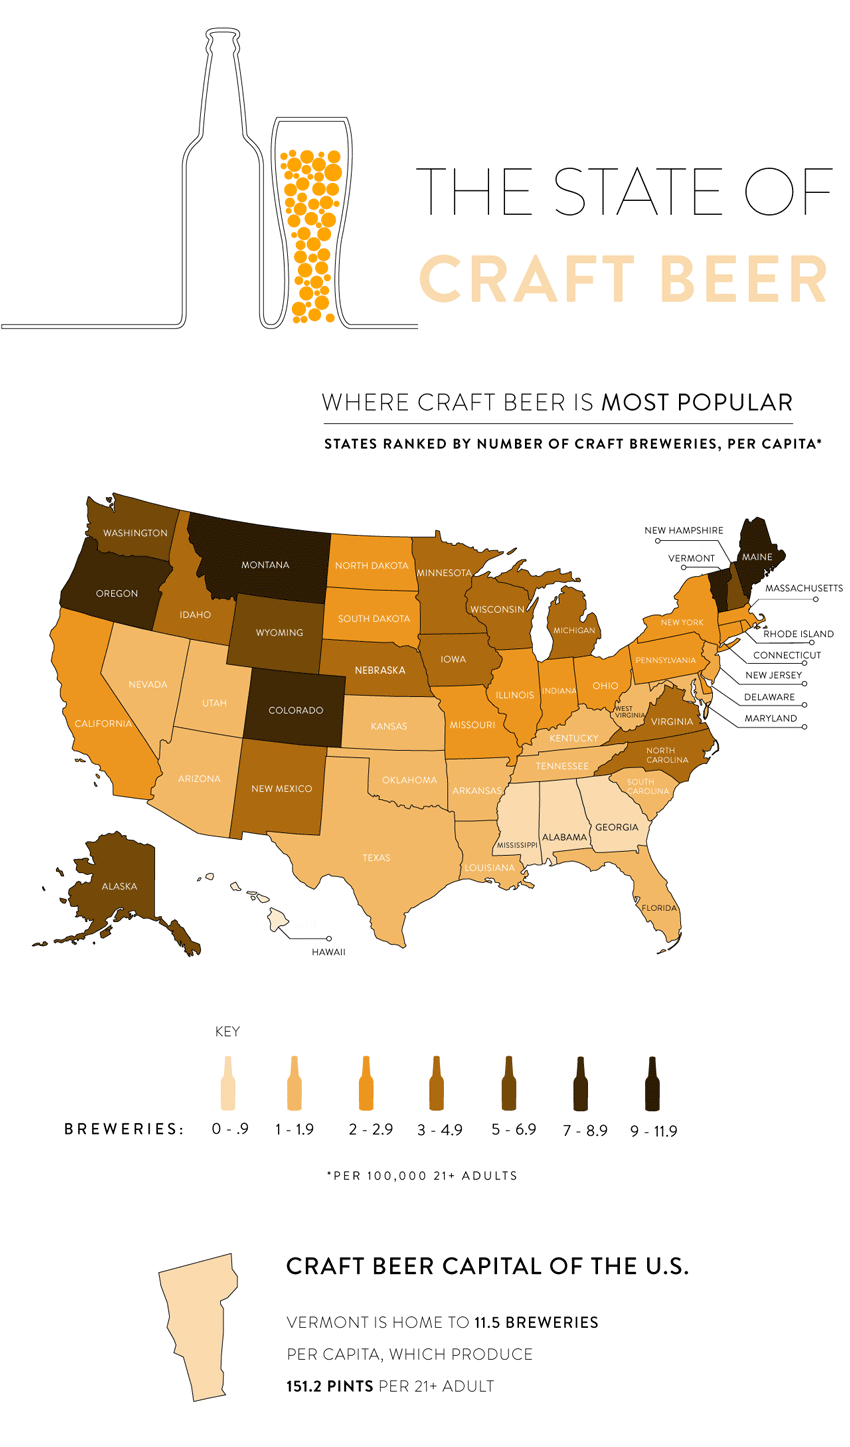
When you picture the biggest craft beer loving state, you might immediately conjure up images of a sunny San Diego brewery or a vegan taco truck surrounding an Austin microbrewery—but would you guess that Vermont is the craft beer capital of the United States? Vermont is home to 11.5 breweries per capita – that’s a lot of beer for the Green Mountain State.
So, which states had honorable mentions? Montana came in second place with 9.6 breweries per capita, followed by Maine with 9.6 breweries per capita, Oregon with 8.5 breweries per capita and Colorado rounding out the top five craft beer states with 8.4 breweries per capita.
Other craft beer enthusiast states are Alaska (6.8 breweries per capita), Washington (6.7), Wyoming (5.7), New Hampshire (5.6), Idaho (4.5), Michigan (4.5), New Mexico (4.4), Minnesota (3.9), Wisconsin (3.7), Nebraska (3.6), North Carolina (3.4), Iowa (3.3), Virginia (3), Pennsylvania (2.9), Delaware (2.9), Indiana (2.8), California (2.6), Ohio (2.6), South Dakota (2.6) and Massachusetts(2.5), which came in at no. 25 on our list.
And which states had the least number of breweries per capita? There were no states without craft breweries, but coming in at No. 50 was Mississippi with 0.6 breweries per capita. Other states that haven’t quite caught the craft brewery fever yet are Georgia (0.9), Alabama (0.9), Oklahoma (1), Louisiana (1), Texas (1.3), New Jersey (1.3), Utah (1.5), Kentucky (1.6), Arkansas (1.6), Maryland (1.6), South Carolina (1.6), Tennessee (1.7), West Virginia (1.7), Hawaii (1.7), Kansas (1.7), Nevada (1.8), Arizona (1.9), Missouri (2), Rhode Island (2.1), Illinois (2.1), North Dakota (2.2), New York (2.2) and Connecticut (2.2).
When looking for nationwide trends and patterns, you can see that there is a heavy craft brewery presence in the Midwest as well as the Pacific Northwest. The South seems to have the lowest amount of craft breweries, which could be due to restrictive liquor laws that give brewers a lot of hoops to jump through to open. For example, laws in Georgia and Alabama ban craft breweries from selling their beer directly to visitors.
Economic Impact
As with any industry, there is a measurable economic impact. When it comes to craft breweries, money is generated back into the economy through wholesale distribution, and through individual retail sales as well as sales at breweries.
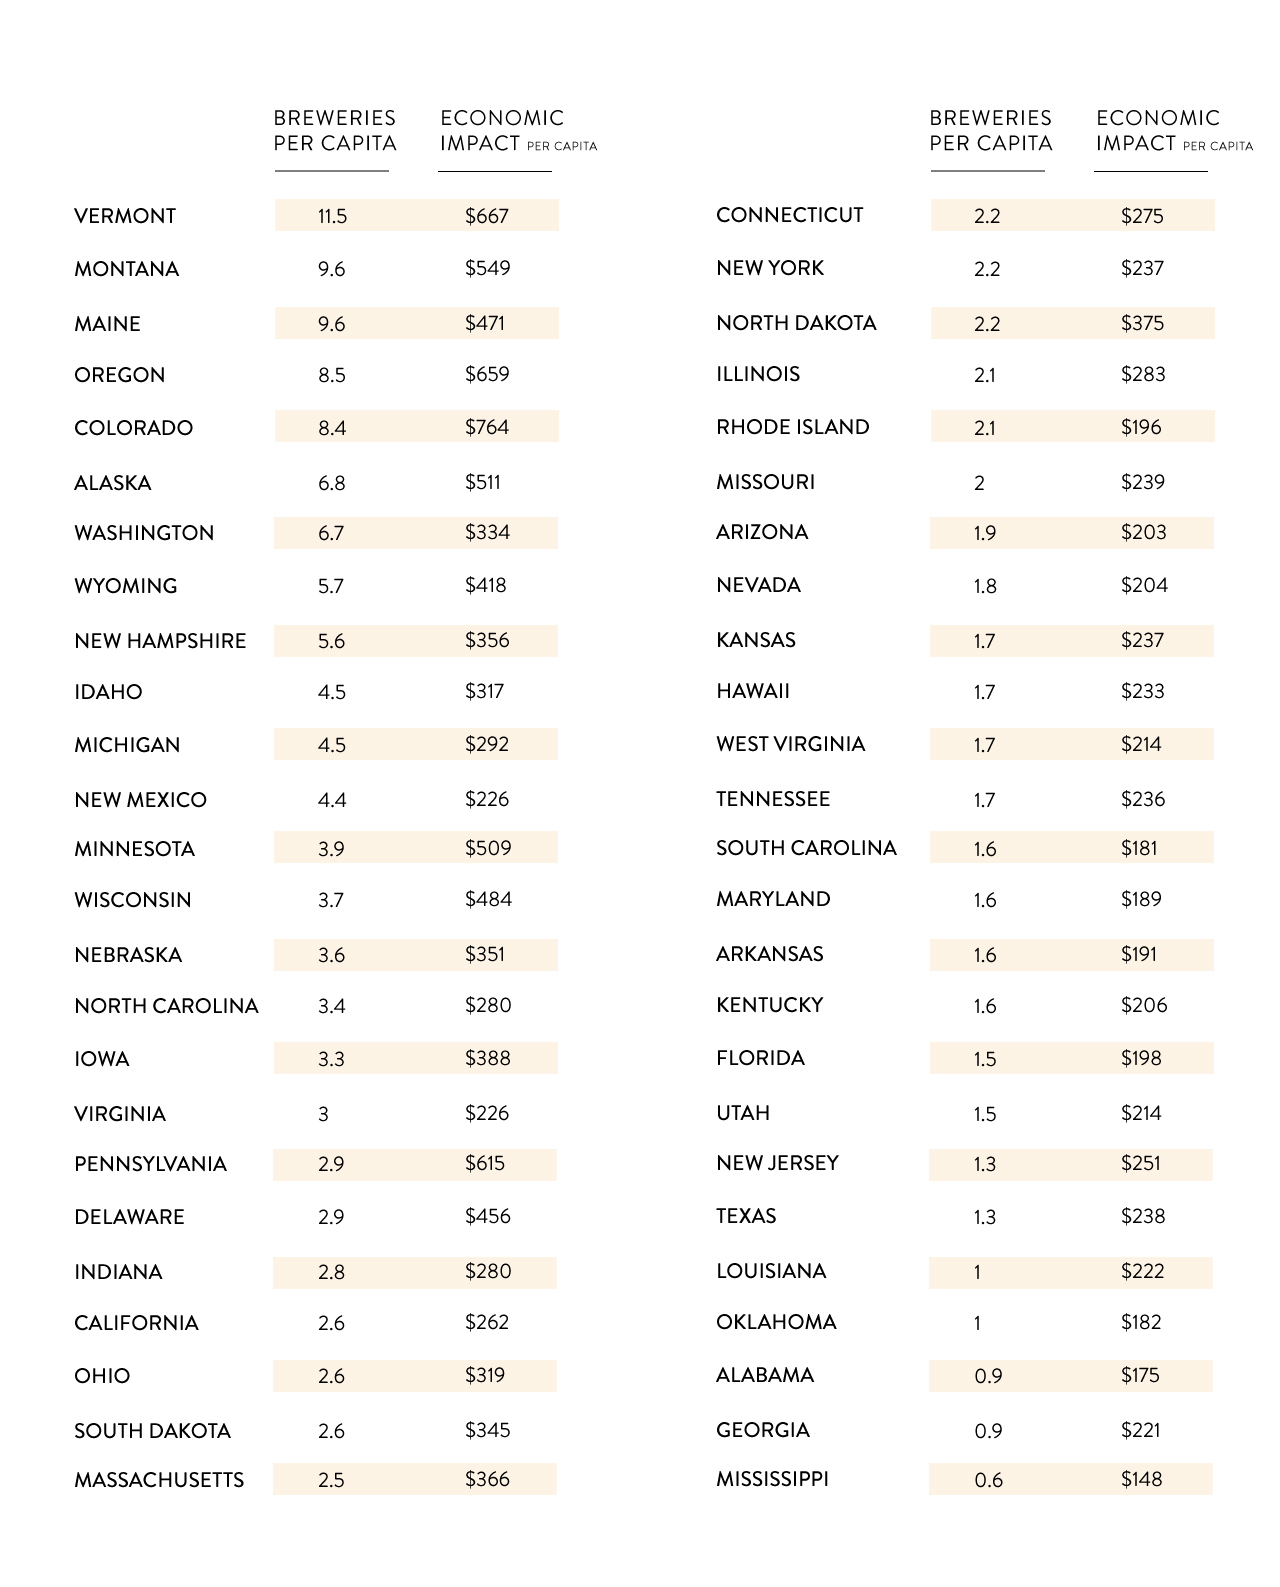
According to data from the Brewers Association, Colorado and Vermont top the nation’s list in terms of craft beer’s impact on state economies. Per capita for 21+ adults, Colorado comes in at No. 1 with an economic impact of $764 per person and Vermont at No. 2 with an economic impact of $681 per person. These numbers represent the overall output of the craft beer industry in each state based on the 21+ population.
Brewery Growth
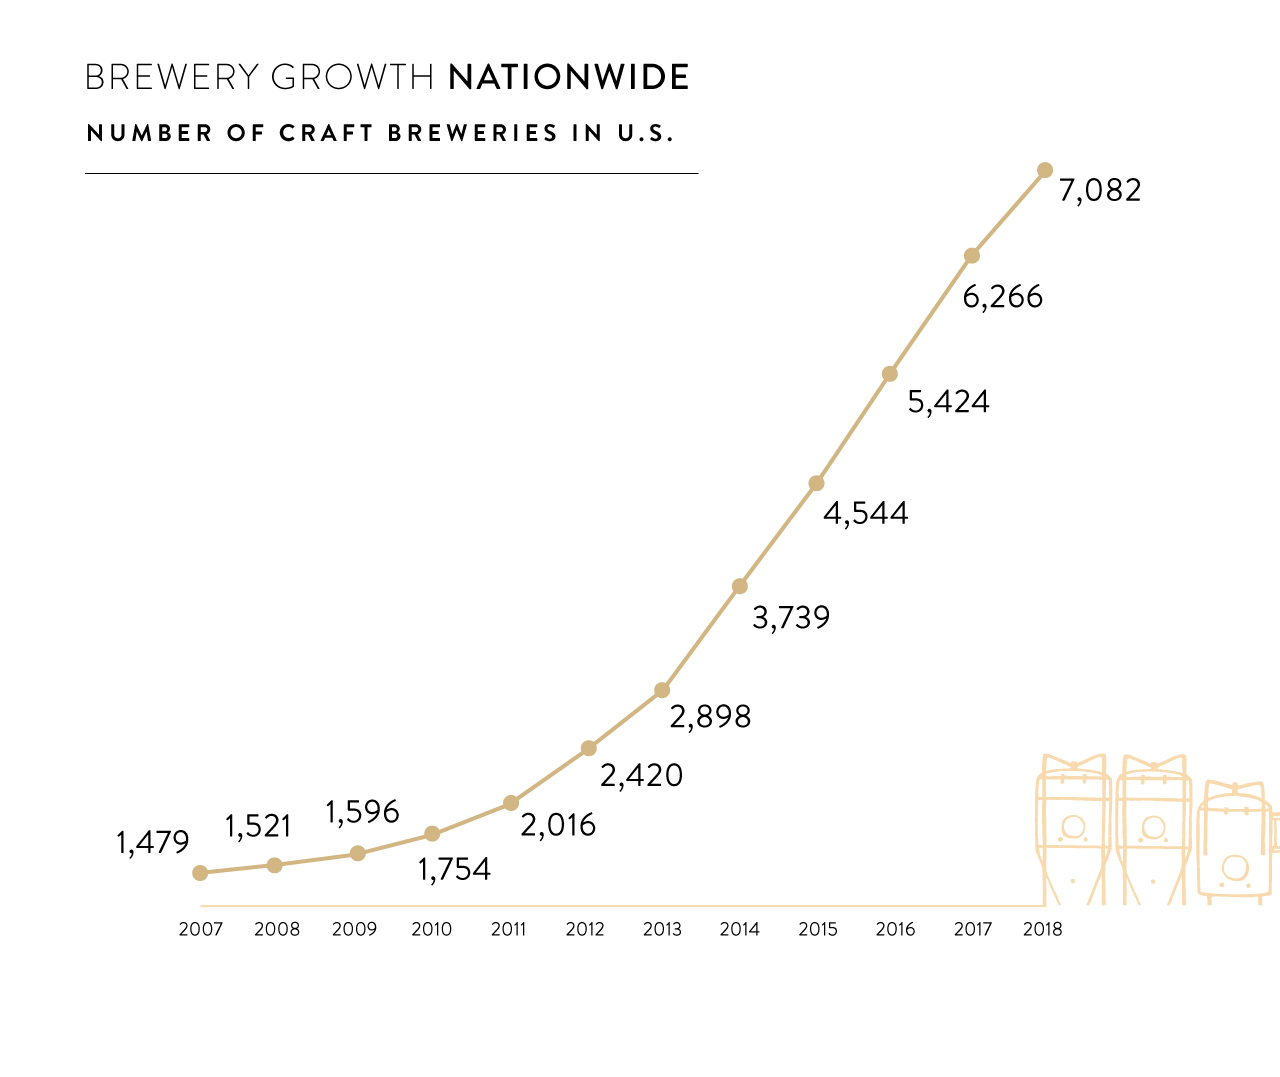
Although craft beer is certainly nothing new, the amount of interest and money in craft breweries has certainly grown exponentially in the last decade. In fact, in 2007 there were just 1,511 craft brewery facilities and as of July 2018 that number has grown to 6,655.
Craft Beer Production
Not only did we want to find out which states had the most craft breweries and how much those breweries are impacted the local economy, but we also wanted to know where craft beer was being produced the most.
Vermont took the lead again here, producing 151 pints per every adult that’s 21 years of age and over in the state. Coming in second was Delaware with 101 pints, Alaska with 96 pints, Pennsylvania with 96 pints, Colorado with 91 pints, Oregon with 86 pints, Maine with 77 pints, Montana and Wisconsin with 60 pints and Minnesota with 40 pints per every 21 and over adult.
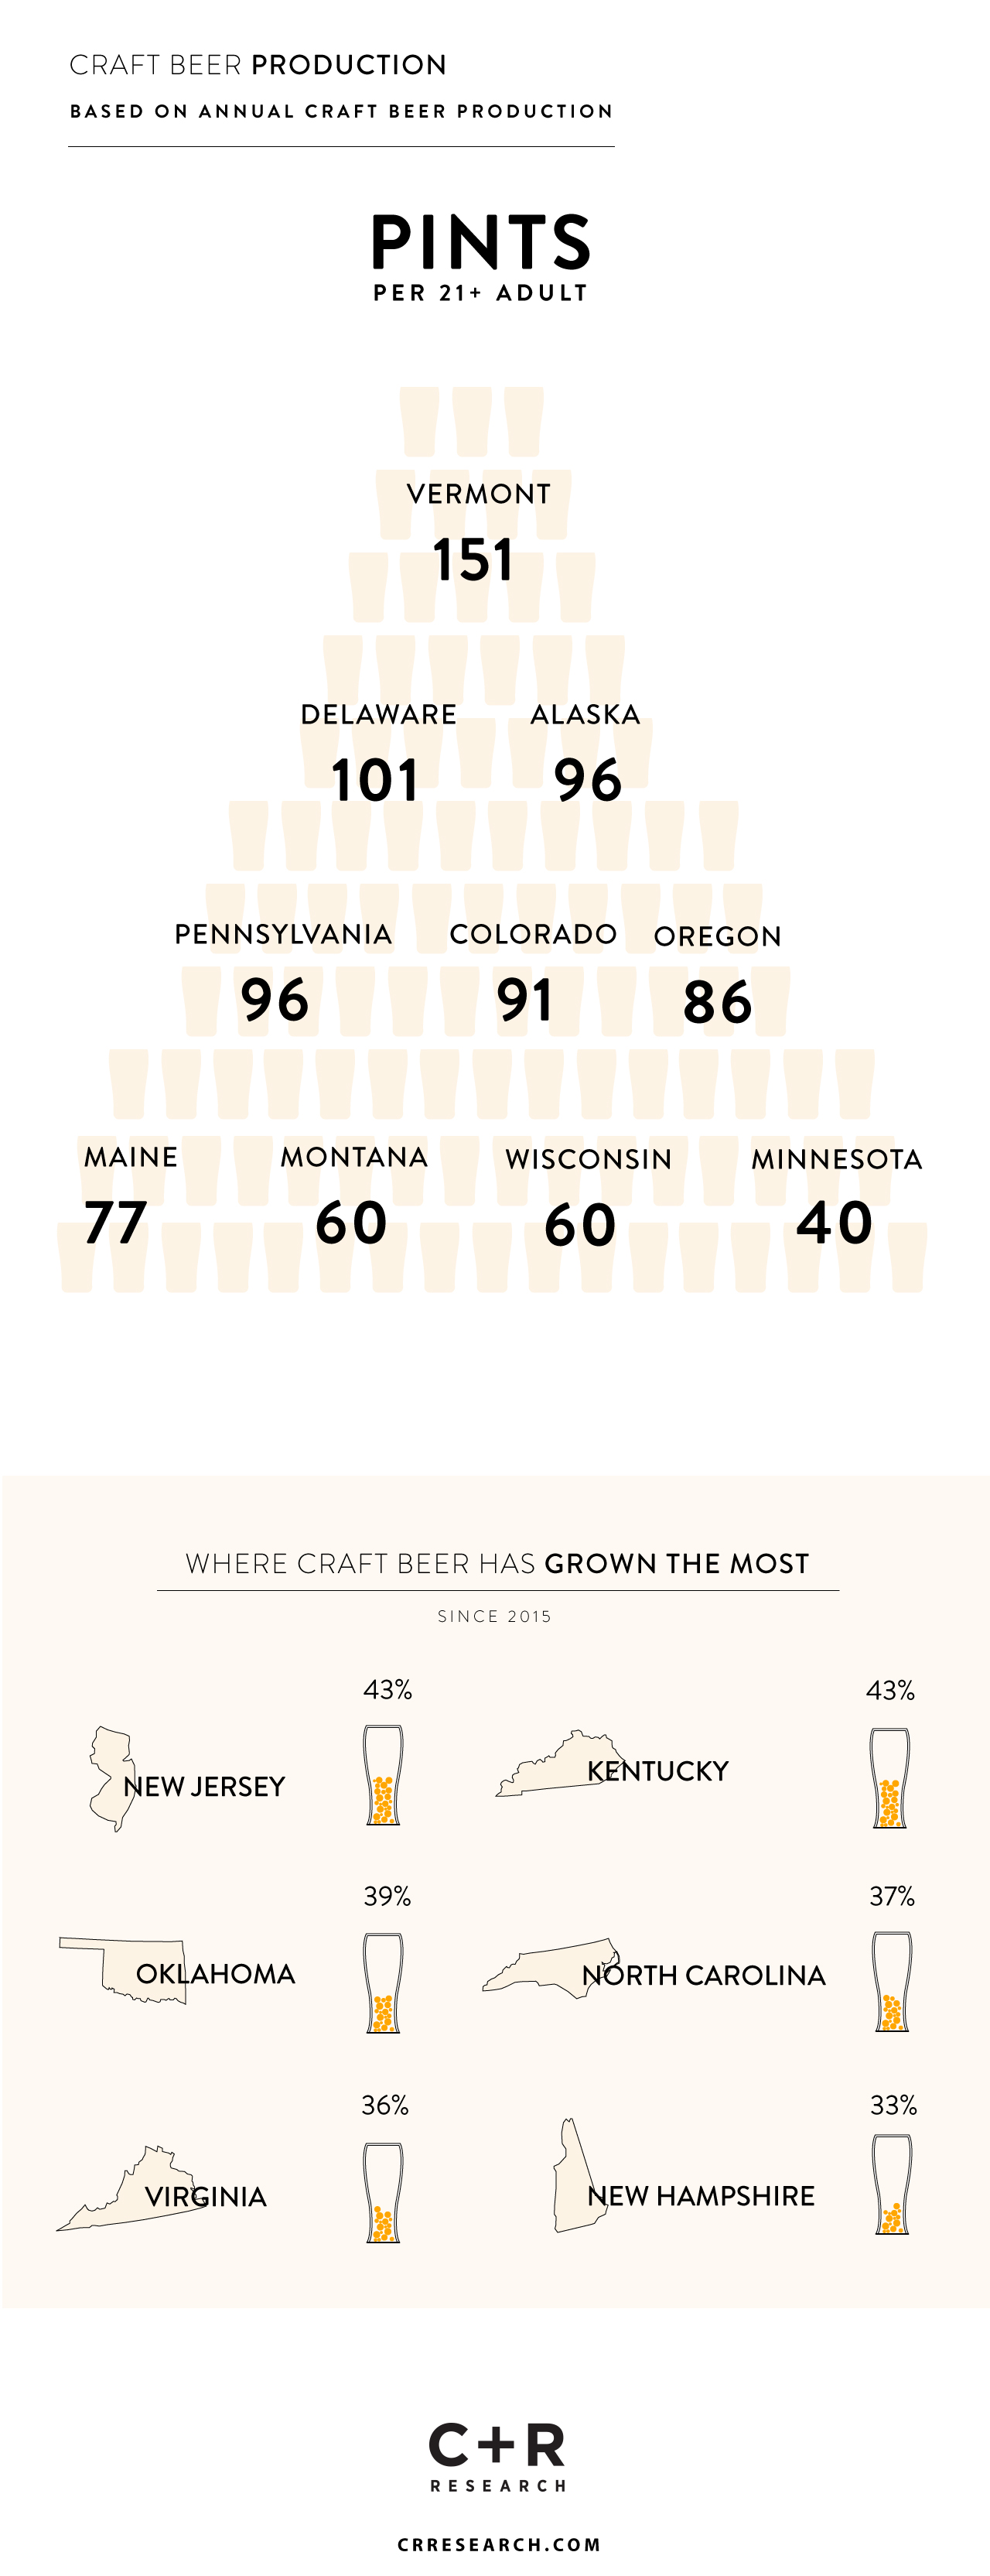
So, where has most of this growth been seen? We tracked where the craft brewing scene has grown the most since 2015—and the numbers might surprise you.
New Jersey and Kentucky tied for first place with 43% growth, followed by Oklahoma with 39% growth, North Carolina with 37% growth, Virginia with 36% growth and New Hampshire with 33%.
What accounts for such a large increase in beer growth in Kentucky and New Jersey? Much of it can be attributed to more liberal laws. In recent years, licensing laws in New Jersey have changed, which have allowed for microbreweries to sell beer by the glass and by the keg. In Kentucky, changes in laws have increased a brewing cap, allowing breweries to produce more beer.
Methodology
Data for this report was compiled from the Brewers Association, which is an American trade group of over 7,200 craft brewers, suppliers, and distributors, as well as the Alcohol and Tobacco Tax and Trade Bureau.
Still thirsty for more craft beer research? Check out the case study we did on craft beer.
explore featured
Case studies