
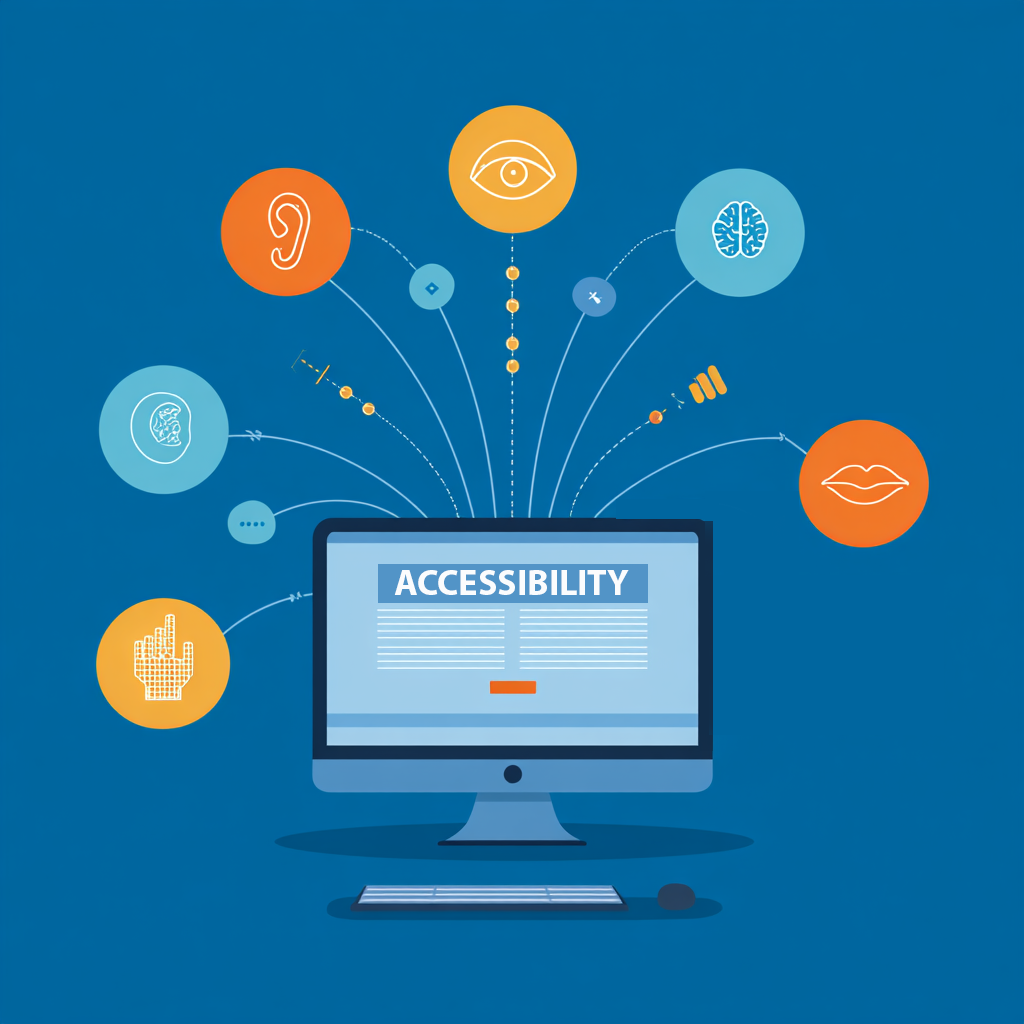
Making Market Research Accessible: Best Practices for Disability Inclusion
Filed Under: Health Care Providers, Patients, Shopper, Associations & Non-profits, CPG, Healthcare, Healthcare Organizations + Nonprofits, Retail, Data Quality, Journey Mapping, Qualitative Research, Quantitative Research, UX (User Experience)

Brett Burba
Director, Community + Panel Innovation
July is Disability Pride Month, and as we reflect on the importance of the Americans with Disabilities Act (ADA), it’s a perfect time to assess the accessibility of your research practices.
As of July 2024, more than 1-in-4 adults in the United States has a disability. With that in mind, whether we’re engaging study participants or presenting findings to stakeholders, it’s important to consider several ADA-compliant fundamentals when designing your next market research study:
Survey and Interview Design
- Remove ornamental formatting. Keep the format basic, clean, easy to read, and minimize the use of color.
- Flatten matrix questions. Instead of asking in a standard grid format, ask about each statement or attribute one at a time as an individual scaled question.
- Similarly, avoid sliding scales. Write a standard, scaled question instead.
- Tweak navigation tools. Ensure a participant can easily navigate through the survey using the arrows, tab, and enter keys, instead of relying on pointing and clicking with a mouse.
- Screen readers are paramount. While testing a programmed screener, enable a screen reader, like the free one from NVDA, and confirm that it accurately communicates all aspects shown on the screen.
- Offer flexible methodologies. For qualitative research, allow respondents to complete interviews via webcam or solely by telephone to accommodate their preferences.
Deliverables
- Enlarge the font (size 18 is a good starting point for presentations) and choose a sans-serif font, like Arial or Verdana.
- Use bold or italics to emphasize specific text rather than color.
- When the data calls for a particular shape, such as up or down arrows to indicate trending, use Microsoft’s built-in symbols instead of adding shapes or drawing them.
- Include section headers and graph titles to clearly introduce the start of a new idea or data set.
- Check the color contrast levels throughout. There are free color contrast analysis tools available to test text and background contrast, like the WebAIM Contrast Checker.
- Add Alt text to convey the information displayed in graphs, pictures, and other visuals.
These are just a few best practices C+R Research has implemented in partnership with its clients. The goal is to remove barriers that might hinder participation from members of the disabled community. Without participation, we can’t develop insights; and without accessibility, those insights lack representation. When your next project arises, ask yourself, “Is this set up in a way that allows everyone a chance to contribute?”
explore featured
Case studies