ShopperPulse™ Perspectives: Buy Now, Pay Later Insights
Filed Under: Shopper, Ecommerce, Financial Services, Fintech, Retail, Advanced Analytics, Path to Purchase, Quantitative Research, Segmentation, Shopper Journey
Kayla Myhre
Director, Shopper Insights Research
Buy Now, Pay Later Insights – Holiday Spending Shifts
As we head into the holiday season, shoppers are gearing up for gift-giving and hosting, and many are turning to Buy Now, Pay Later (BNPL) to make it all happen. With economic pressures continuing to loom, flexible payment options can be both a convenience and a lifeline for consumers navigating tight budgets and rising costs.
In 2021, we conducted research exploring the then-emerging use of BNPL. Since then, BNPL has gradually evolved into a mainstream financial tool that continues to shape how consumers shop.
At C+R, our ShopperPulse experts are continuously keeping an eye on changing shopper behavior. Recently, we conducted new proprietary research highlighting payment methods as a key step in the path to purchase. Here, we’ll revisit our 2021 study to see how things have changed and where shoppers stand with BNPL in 2025.

From Risk to Reward: Changing Perceptions of BNPL
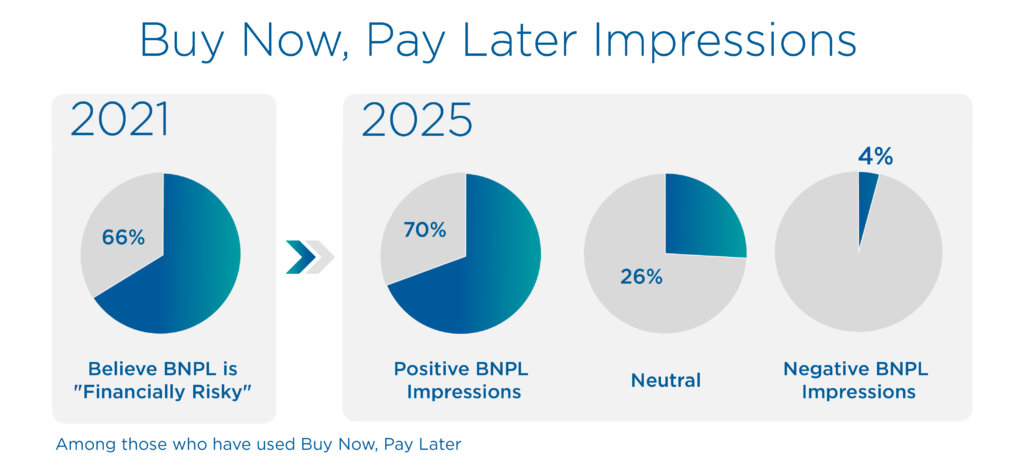
Despite growing adoption at the time, our 2021 research revealed that two-thirds of shoppers considered BNPL “financially risky”. Over half had experienced regret related to a BNPL funded purchase or missed an installment payment.
Fast forward to 2025. The narrative has shifted, with 7 in 10 users reporting positive experiences. For the minority who are overtly dissatisfied with BNPL, they note high fees, debt accumulation, and minimal cost savings as pain points. Still, despite occasional purchase regret, the benefits of spreading out payments outweigh the drawbacks.

This shift in sentiment reflects not just improved user experiences but also broader cultural and economic shifts. Economic instability has become a greater concern, which has made flexible payment options like BNPL more appealing, or even necessary.
Evolving BNPL Use: Wants vs. Needs
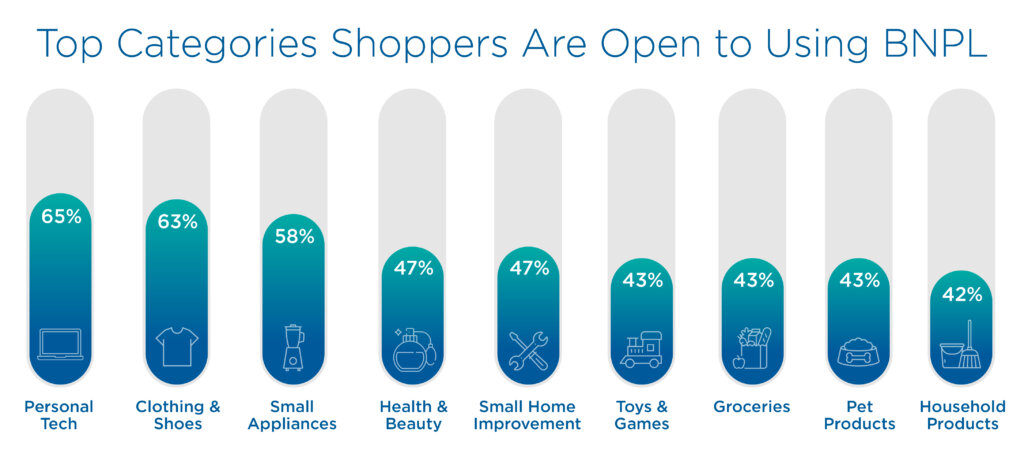
Today, shoppers are turning to BNPL for similar purchases compared to 2021. More discretionary, non-essential items, such as clothing, electronics, small home appliances, and health & beauty products remain top categories.
Given the increasing financial pressures on many consumers and the expansion of BNPL offerings, use of the service for essential goods such as groceries, household items, and pet products is expected to rise. Furthermore, interest in using BNPL for these categories remains higher among non-users than current users, suggesting potential for future adoption.

What This Means for Marketers and Retailers
BNPL is no longer just about convenience—it’s also a reflection of how shoppers are adapting to financial pressure and rethinking how they manage their spending. For marketers and retailers, this evolution presents both a strategic opportunity and a growing challenge.
The growing use of BNPL for essential purchases signals a broader shift in consumer priorities. While not exclusive to financially strained shoppers, its use for necessities can serve as a behavioral indicator of value-seeking behavior, offering marketers rich insights for refining personalized messaging and offers.

Still, BNPL use extends across income levels and categories, so broader opportunities also exist. BNPL has been accepted in stores at some major retailers (Target, Walmart, Macy’s, Sephora, etc.) for several years, yet the majority of its transactions occur online. As brick-and-mortar shopping still dominates, retailers have a unique opportunity to reduce friction at checkout and increase conversion. Whether it’s online or in-store, tailoring promotions and messaging to highlight flexible payment options can help brands meet shoppers where they are.
However, with economic instability driving some BNPL adoption and use, brands must approach this space with empathy and clarity. Transparent communication about payment terms, fees, and total costs will be crucial to building trust and loyalty, especially as shoppers become more cautious about BNPL credit implications.
Ultimately, as BNPL has shifted from a perceived financial risk to a practical tool for managing spending, brands that understand and adapt to these changes will be best positioned to build trust, drive conversion, and stay relevant long term.

Now On-Demand:
Shopperpulse webinar
What Shoppers See, Think, and Feel Without Saying a Word

